TIP
This article needs some familiarity with GWAS (Genome wide association studies) and related concepts. Checkout my GWAS and beyond article for a brief overview.
What?
WebGWAS is a tool that allows researchers to obtain GWAS summary statistics for a phenotype of interest without needing access to individual-level genetic and phenotypic data. The web app can be used to study custom phenotype definitions, including inclusion and exclusion criteria, and to produce approximate GWAS summary statistics for that phenotype.
Why?
Conducting a GWAS is:
- expensive,
- time consuming, and
- requires access to large-scale individual-level genetic and phenotypic data that raises privacy concerns.
One way to deal with this is to offer precomputed summary statistics for a bunch of phenotypes.
That’s what Pan UK Biobank does. However, the results are restricted to a predefined set of phenotypes and cannot easily be used to study custom phenotype definitions that may be more relevant.
One other way could be to somehow use the existing summary statistics to approximate the statistics for any arbitrary phenotype.
This is what WebGWAS does.
How?
WebGWAS allows users to define arbitrary phenotypes, and uses existing summary statistics to rapidly compute GWAS results for those user-defined phenotypes.
Web App Flow
1. Choose a phenotype
You can choose a single phenotype or a combinations of phenotypes with logical operators. For example, you can choose:
- P1,
- P1 AND P2,
- P1 OR P2 AND NOT P3, … etc
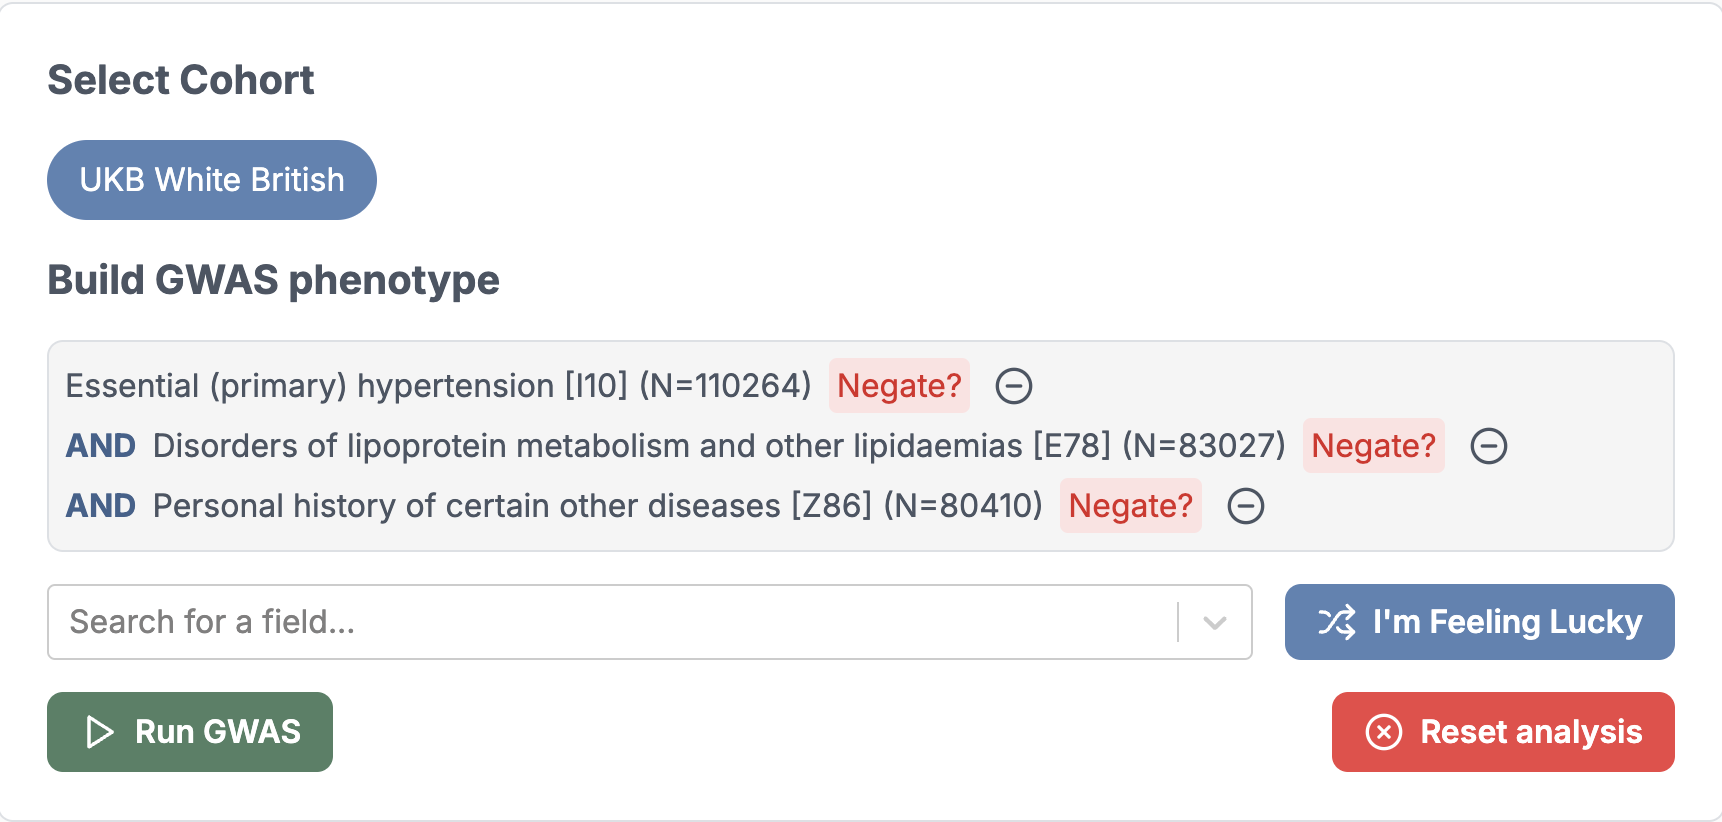
2. Run GWAS
After choosing a phenotype, you can Run GWAS, which does the following:
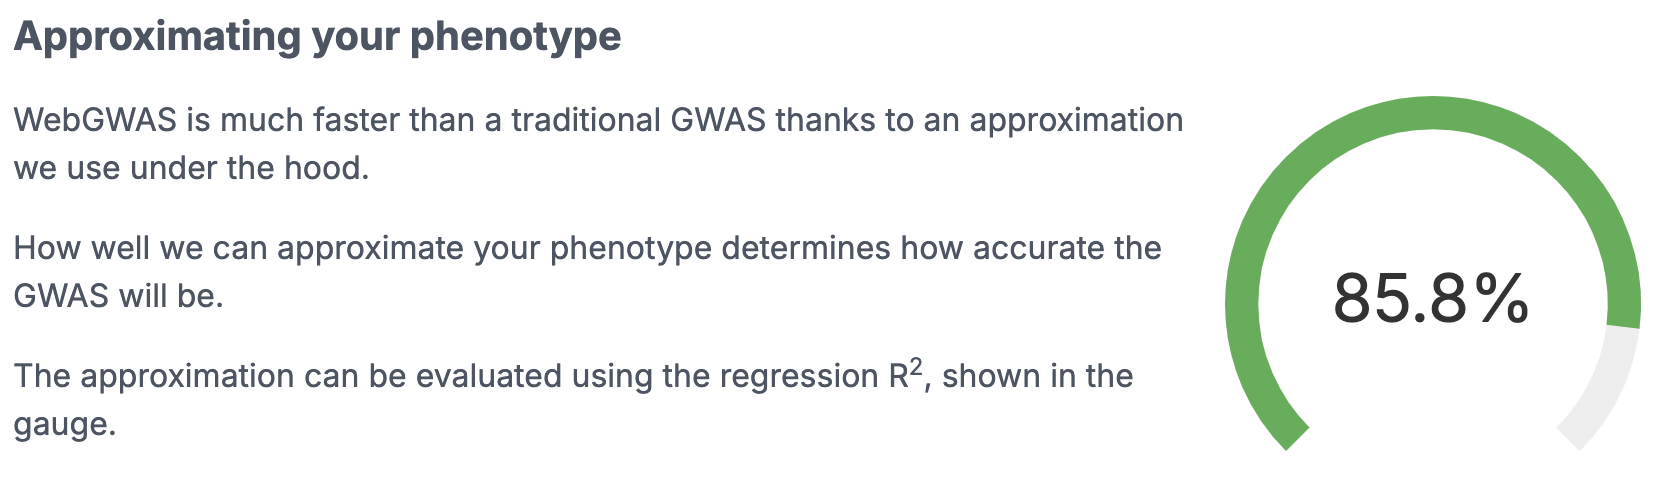
- It approximates your custom phenotype as some linear combination of the existing phenotypes present in its database. The quality of this approximation is shown.
- It calculates the approximate GWAS summary statistics for the custom phenotype using the precomputed summary statistics of the existing combination of phenotypes.
3. Download Results
You can download the GWAS summary statistics in a zipped format.
Detailed Methodology
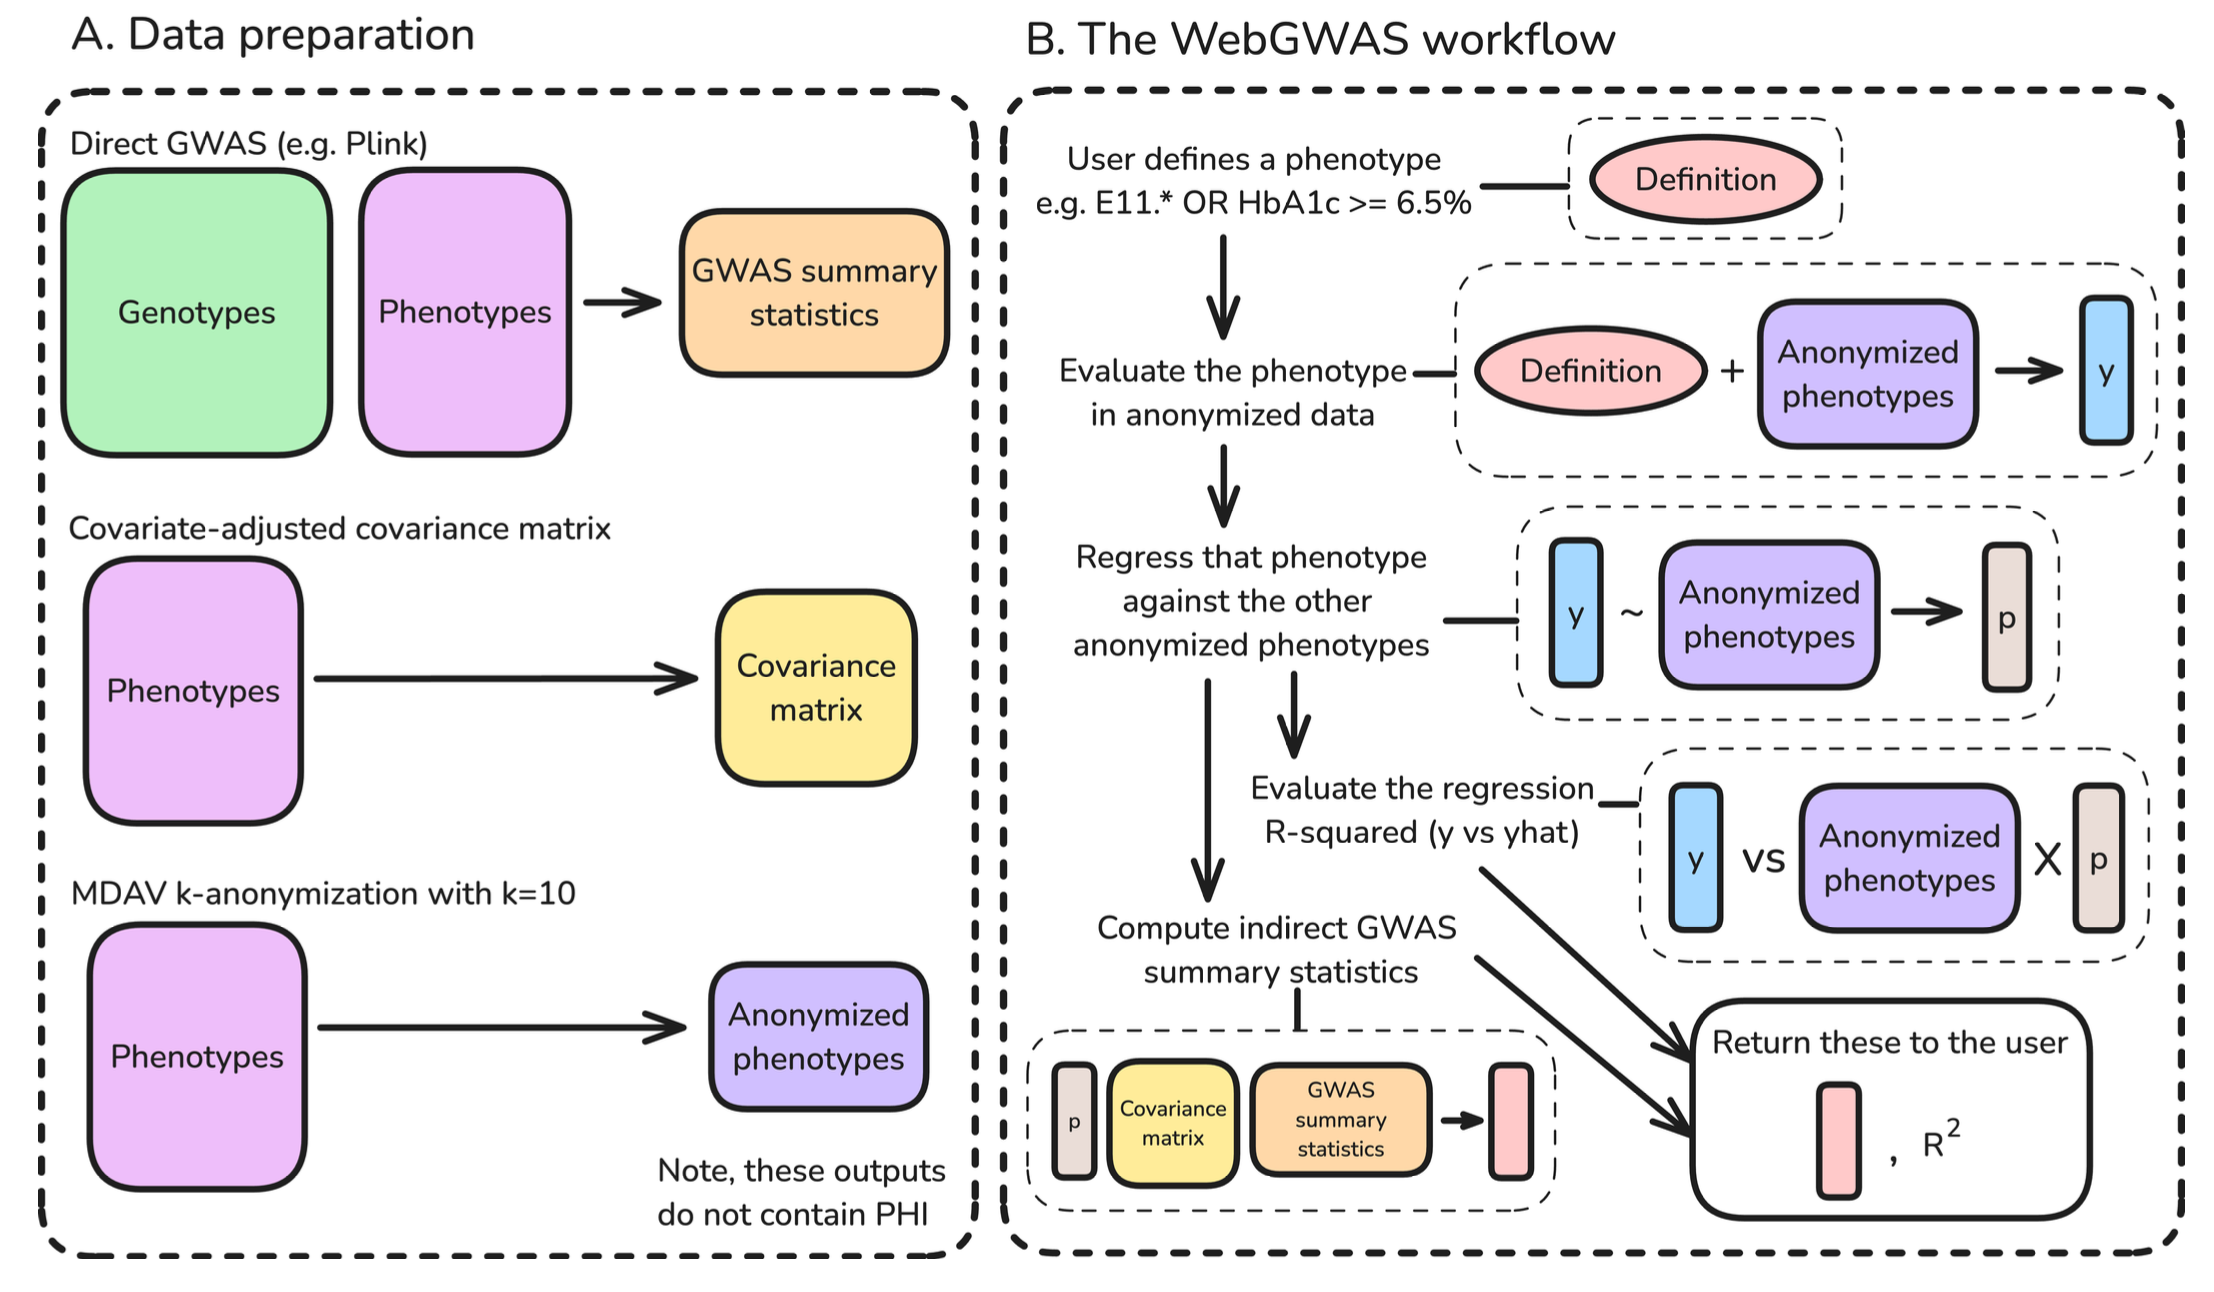
Required Artifacts
Three artifacts are needed for WebGWAS:
- GWAS summary statistics,
- a covariate-adjusted phenotypic covariance matrix, and
- anonymized phenotypes
WebGWAS computation
1. User defines a phenotype using the web interface
Diabetes [E11]
OR HbA1c level >= 6.5%
2. Phenotype Evaluation on Anonymised Data
That phenotype definition is evaluated in anonymized data to produce a vector of values. What does it mean?
Note that our custom phenotype consists of 2 phenotypes, Diabetes(E11), HbA1c level, with a logical OR. Let’s look at a sample individual level phenotype data:
| Individual | E11 (Diabetes) | HbA1c (%) |
|---|---|---|
| 1 | 1 | 7.2 |
| 2 | 0 | 6.1 |
| 3 | 0 | 6.8 |
| 4 | 1 | 6.3 |
| 5 | 1 | 7.0 |
| 6 | 0 | 5.8 |
| 7 | 1 | 6.7 |
| 8 | 0 | 6.5 |
| 9 | 0 | 5.9 |
Now, using the condition for our custom phentoype, we get individuals 1, 3, 4, 5, 7, 8 that satisfy our condition. But of course, we can’t use this individual level data because that would raise privacy concerns. So we anonymize this. Instead of using individuals, we use groups like shown below:
| Group | E11 (Diabetes) | HbA1c (%) |
|---|---|---|
| 1 | 1 | 6.80 |
| 2 | 0 | 5.93 |
| 3 | 0 | 6.65 |
Now, on this anonymised phenotype data, applying our logical condition gives us groups 1 and 3. Hence, our evaluated vector is:
NOTE
The anonymisation algorithm used in WebGWAS is MDAV (Maximum Distance from Average Vector). You can read more about it here.
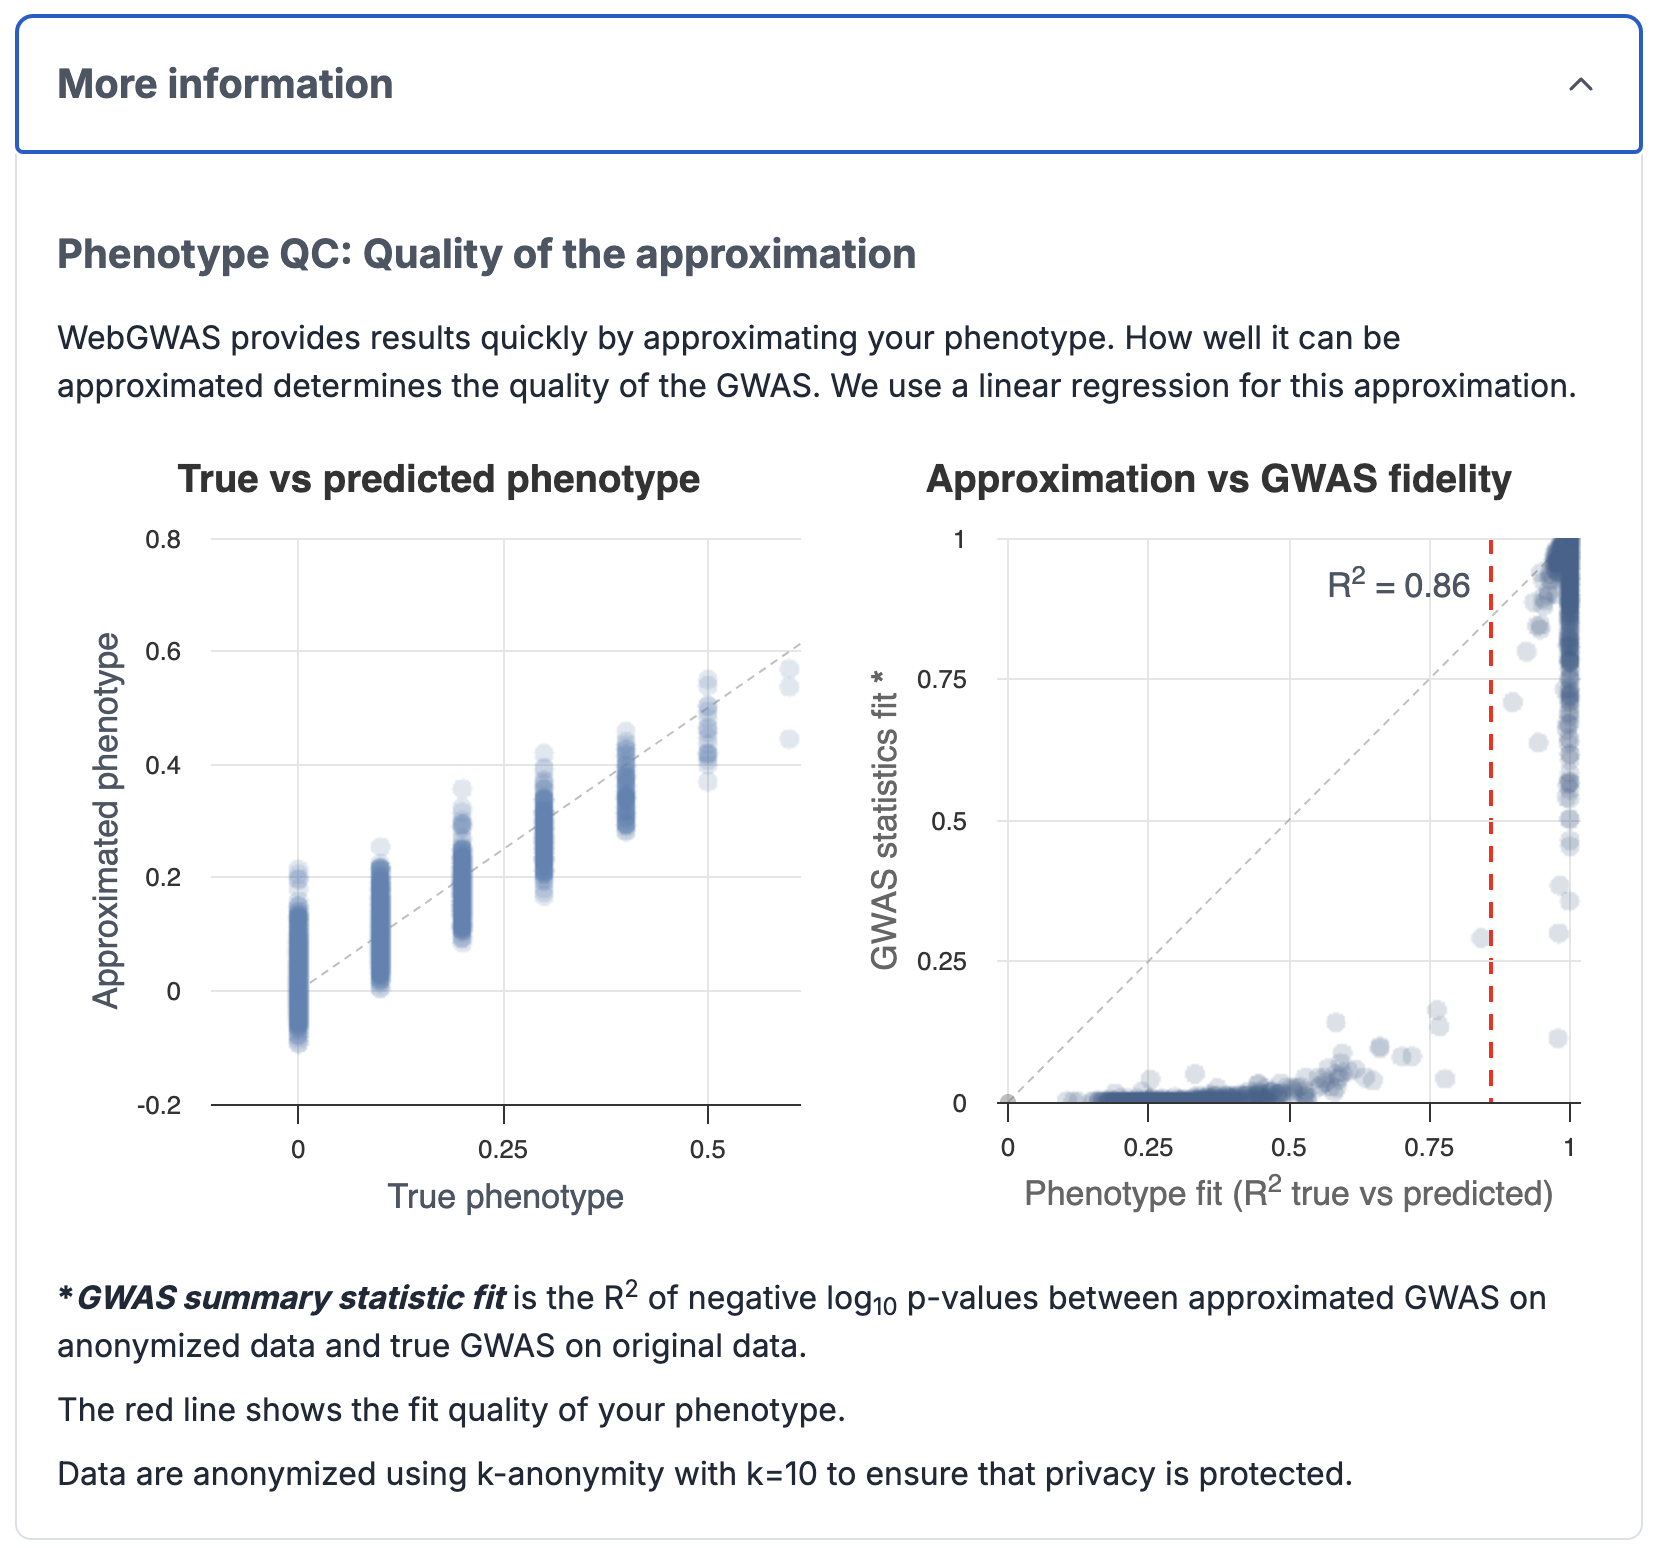
3. Approximate the evaluated vector
The evaluated vector is approximated by the anonymized features using linear regression. But why?
Think about this: If an individual does have diabetes OR HbA1c levels >= 6.5%, how do I express this custom phenotype? How do I know how much each phenotype exactly contributes to this custom phenotype, given our data? To determine this contribution (weights), we carry out the regression.
We approximate our custom phenotype as a linear combination of the existing phenotypes.
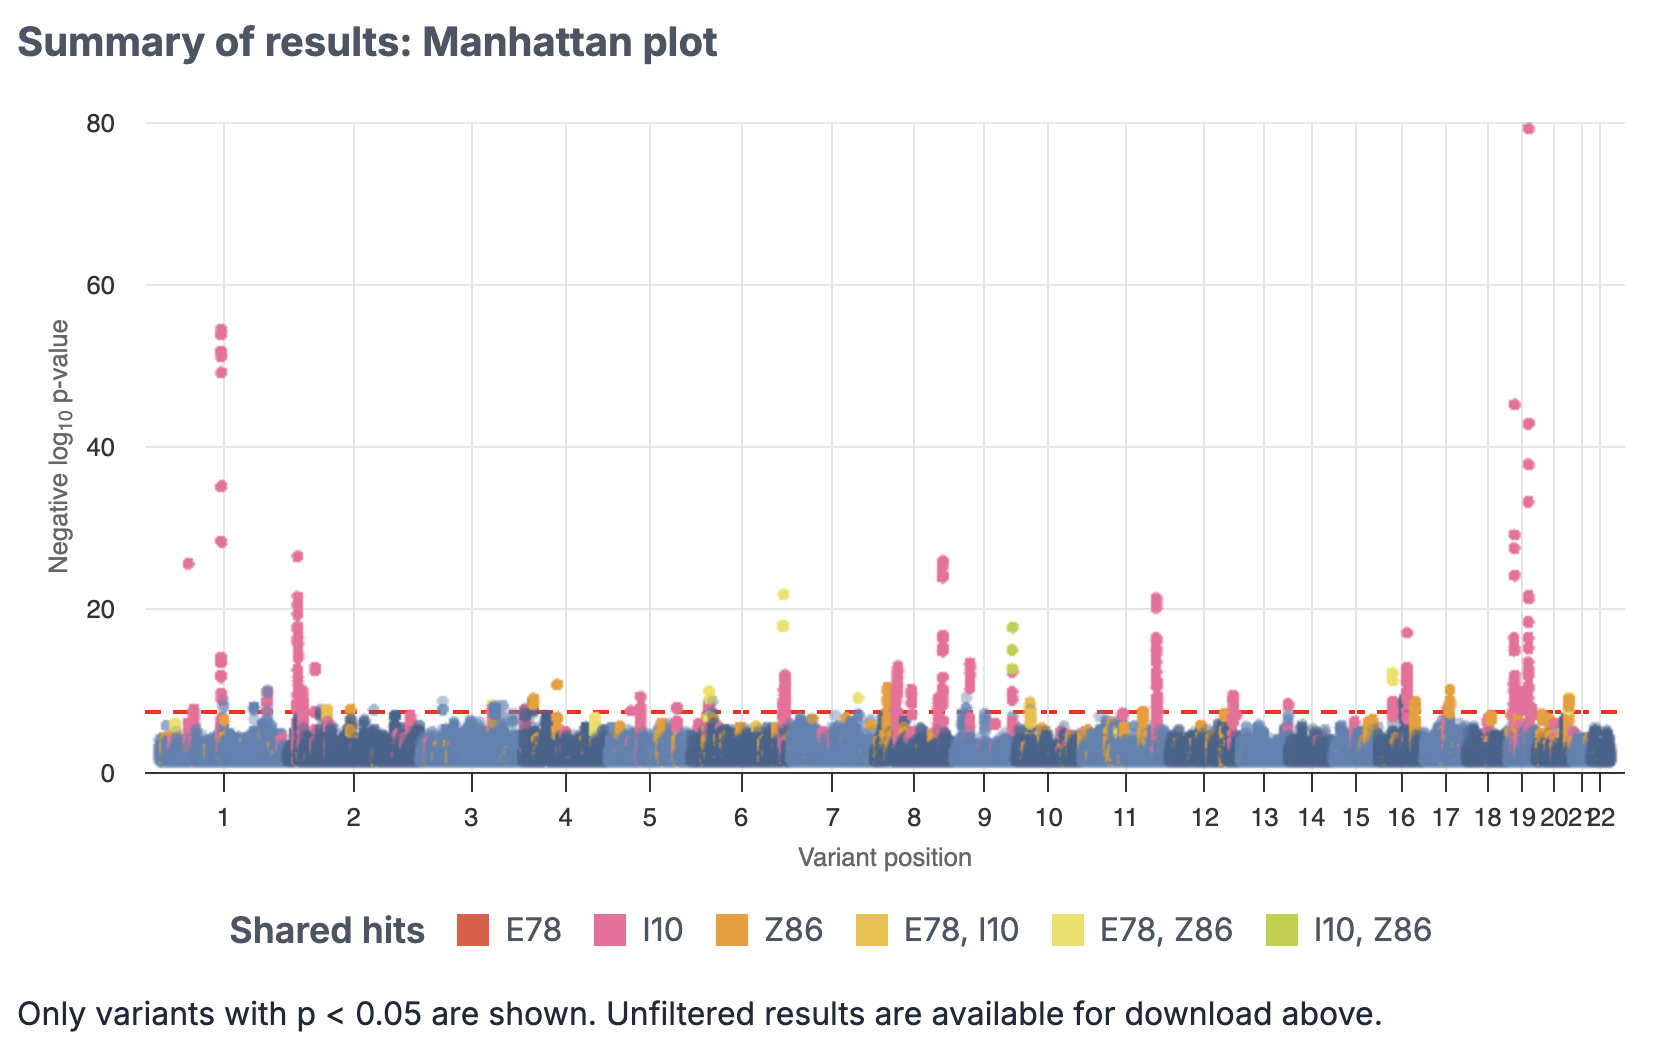
4. Perform Indirect GWAS
The authors have proven that if we have a custom phenotype that can be expressed as a linear combination of the existing phenotypes, we can compute their GWAS summary statistics by using the summary statistics of the existing phenotypes. This computation is what they call as Indirect GWAS.
This process only uses the phenotype approximation coefficients, the covariance matrix of the features, and the pre-computed GWAS summary statistics for the features.
Results
The quality of the computed GWAS summary statistics depends on how good the phenotype has been approximated.